Field Report
Commercial Real Estate's 40-Year Tailwinds Reversed
aside class="direct-answer-host">
I don't think the average person understands how much the U.S. 10-Year Treasury yield impacts commercial real estate pricing.
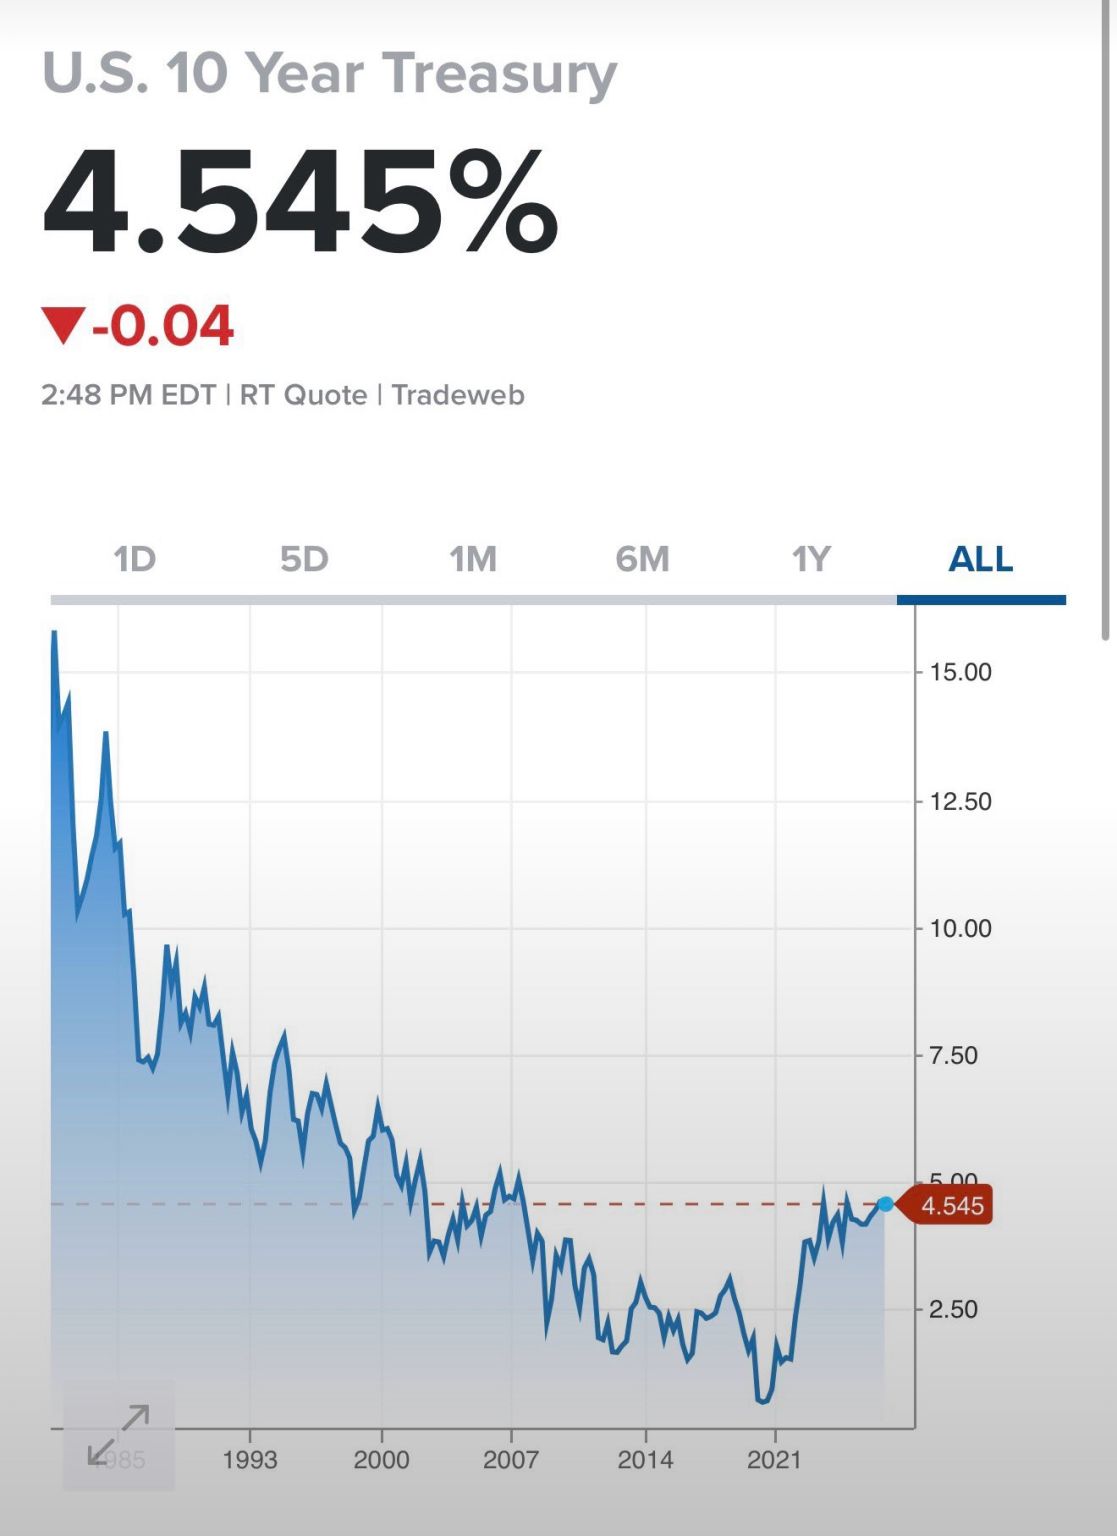
Look at this chart recently highlighted by StripMallGuy on LinkedIn:
The "Genius" Illusion
For 40 years, the U.S. 10-Year Treasury yield was on a secular, unrelenting decline, falling from the high teens in the early 1980s down to near zero by 2020.
As one observer aptly noted in the comments, "candidly, low rates for 40 years made everyone in real estate look like geniuses."
When borrowing costs constantly decrease, property values consistently go up simply due to cap rate compression. You didn't need to be a brilliant operator to make money; you just needed to hold the asset while the Federal Reserve and the bond market provided a massive macroeconomic tailwind.
The Generational Wealth Machine Breaks
The implications extend far beyond institutional skyscrapers. For decades, American families used this exact mechanism of steadily dropping rates to pull equity out of their homes every few years. They funded college, renovations, and investments without ever having to sell.
When rates bottomed out and were kept "dirt cheap" for too long, that mechanism was effectively stripped from the marketplace for younger generations. Now, with rising rates, the door has slammed shut.
The Velocity of the Shock
It is true that a 4.5% Treasury yield isn't historically astronomical. If you look at the 1990s, we were significantly higher. But the real danger isn't the absolute number. It is the velocity of the hike.
Underwriting models built in 2020 or 2021 rarely anticipated such rapid rate hikes. Syndicators and sponsors planned for a refinance in 5 years, assuming the macroeconomic environment would remain largely unchanged. The sudden shock breaks those models entirely.
As Cyndi Peach summarized perfectly in the discussion: "A 4.5% Treasury is not a reason to stop buying. It is a reason to stop overpaying... Buying a 6% cap rate and praying for rate cuts is not a strategy. It is speculation wearing an Excel spreadsheet."
As the Seagull says: buying property on cheap debt and praying for rate cuts is just winging it on borrowed time.
The 40-year tailwind has reversed. The era of spreadsheet speculation is over. Now, we find out who actually knows how to operate real estate in a world of real interest rates. When artificial credit expansion hits a sovereign ceiling, capital begins seeking tangible specie over financialized paper. This marks the timeless balance described in David Hume's Price-Specie-Flow Mechanism. Track how these debt-service milestones and Treasury refinancing pressures compound on our living Fiscal Dominance Tracker.
Test Your Understanding
Digestion matters more than consumption. Prove you retained this report's core signals before heading back to the tape.
Q1.What was the 40-year tailwind behind commercial real estate?
Q2.What happens to commercial real estate when the 10-Year yield spikes?
Q3.Why are leveraged owners trapped as their loans come due?
NEXT FIELD MISSIONS // DOWNSTREAM FREQUENCIES
Can Elon Musk Pay Off the US Debt? The Math of a $36 Trillion Supercycle
Elon Musk warns that federal debt will bankrupt America. Could the richest human on Earth write a check to wipe it out? Here is the raw arithmetic.
Cash as an Option on Volatility: Why We Wait
Cash is not dead paper. It is a live ticket to buy distressed assets when panic strikes. Learn why patience wins market cycles.
Are you prepared for the next cycle?
Take the 2-Minute Advisor Check to assess your financial stage and get on the waitlist for private signals.
JOIN THE SEAGULL INTELLIGENCE DISPATCH
Starts with a free 5-day course on the framework. Then weekly contrarian macroeconomic telemetry, debt acceleration alerts, and unhedged field notes before consensus wakes up. Zero advertising. Zero spam.
STATUS: ENCRYPTED CARRIER // ZERO TRACKING PIXELS // 1-CLICK DISCONNECT ANYTIME
Reader Comments (1)
This is a fantastic analysis! I've been watching the cap rates compress for a decade and wondering when the music would stop.
The most interesting part is how this will impact syndicators who assumed a permanent zero-interest-rate environment.
This heading should be bold text <script>alert("HACK")</script>[Image removed]